PDB & Jelly Time
- Oct 13, 2016
- 3 min read
While starting my journey through exercism.io, I came across a video called “So you think you can PDB?” This talk was given by Clayton Parker at PyCon 2015. He demos and explains the many useful commands of PDB in an easy-to-understand manner with a dash of humor. Short for Python Debugger, it is a handy, built-in debugging module. Here are some of my takeaways:
There are two ways to invoke the debugger:
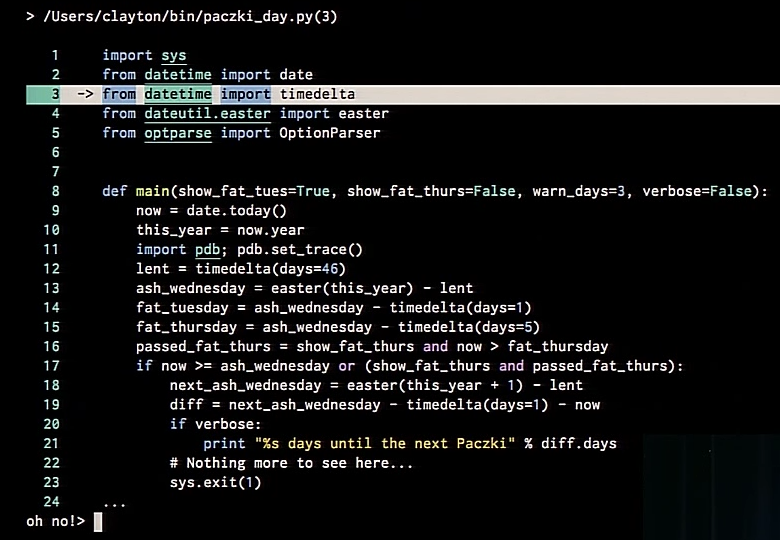
1. Directly in the script. Simply type import pdb; pdb.set_trace() within the code and then run the script as usual. The command line will display (Pdb) once it has hit that line. From there, you can proceed line-by-line through your code until you hit your error. Type n to proceed through each line, or type n once, and then 'Enter' each time thereafter to repeat the same command.
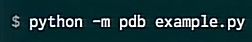
2. Start a script with pdb directly. This will trace the entire script starting at line 1. The line that you're currently on will be displayed.
Commands
Displaying surrounding lines of code (list or l)
To show the current context of the marker, type l (that's a lowercase L), and the next 10 lines of code from the current location of pdb will be displayed. Additionally, to display lines further along the file, type 'l <starting>, <ending>'. For example, if you want to see lines 110, 118, type 'l 110,118'.
Repeating a previous pdb command
To re-execute a pdb command that was just done, simply hit 'Enter'. This saves time from continually re-typing the command.
Examining variables
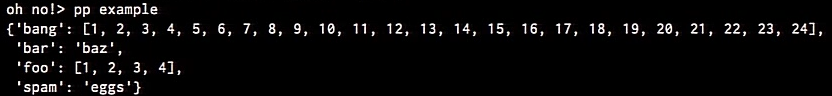
To find out what a variable is currently set to, use print or p followed by a space and the name of the variable. Reading dictionaries in the command line can be difficult, but it can be pretty printed using pp <variable>.
example dictionary without pretty print:

example dictionary with pretty print:
A word of caution when using pdb: if there is a variable name that clashes with a pdb command, the pdb command will execute and the variable will not be displayed. Sadness.
Examining a function
While next or n will walk through each line in the script, it will not walk through functions. step (or s) to the rescue! Once you're in the function, continue to use n. This is a powerful command for examining source code without needing to dig it up yourself.
Skipping over loops
Not every loop needs to examined. To skip it, type until until the next line of code after the loop is displayed.
Skipping over functions
Not every method needs examination. To skip, type return or r. The return value of the function will display.
Setting additional breakpoints within an existing set_trace() breakpoint
If there's a line that you want to set an additional breakpoint for, type break or b followed by a space and the line number. To clear the breakpoint, type clear, space and the line number.
Navigating the current stack
Say you are thrown into a file outside of your own (package, library, framework, etc.) and you want to see which file you are in. where or w will display the absolute path and the > sign will indicate your location.
Quitting pdb
quit or q.
Help
Type help or ? while (Pdb) is displayed in the command line. help help will get you help on using help. Don't forget about the docs either.
pdb++
An extension of the pdb module, pdb++ offers a more visually pleasing debugging experience. Features include colorful tab completion, optional syntax highlighting and sticky mode. Sticky mode highlights the current line traced, making it easy to follow the flow of execution. To make it yours, pip install pdbpp or to learn more about it, head to the package index here.
Happy debugging!
Comments